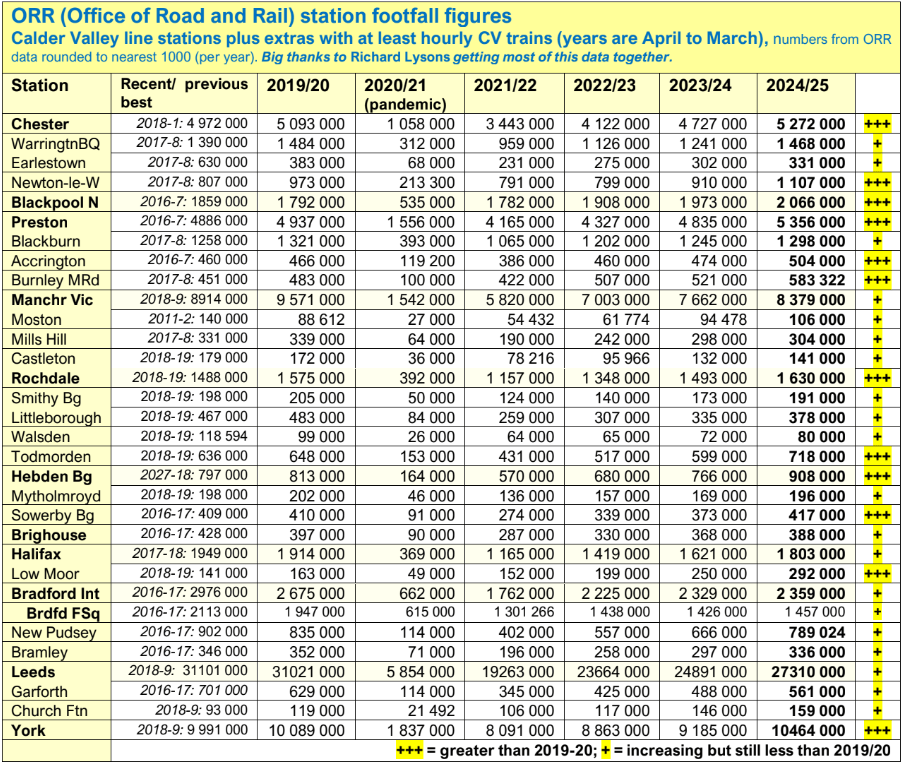
Here are our line’s station footfall statistics up to Spring 2025, published just before our pre-Christmas issue. Good to note just about all continue to increase, taking 2024-5 as comparison. Final column of table shows whether total is now greater than (immediately) pre-Covid. You can study the results yourself. Note “+++” values for a number of stations indicating that passenger numbers now exceed pre-pandemic. Rochdale, Todmorden, Hebden Bg, Sowerby Bg, and Low Moor fall into that category. Todmorden as well as Hebden Bridge has been doing well. Mytholmroyd, Halifax, and Brighouse have still to catch up. Note also that traditional commuting destinations such as Manchester Victoria, Leeds and the two Bradford stations are not growing as fast as medium and smaller size places. But note Chester, Blackpool, Preston, Accrington, Burnley and York are all in the “+++” category. Blackburn, like Halifax, lags slightly in its recovery. Both towns surely have potential to attract more visitors by rail: Blackburn’s cathedral and market; Halifax with its own market regenerated and its station just a quarter of mile from the unarguably unique Piece Hall. ORR (Office of Road and Rail) station footfall figures Calder Valley line stations plus extras with at least hourly CV trains (years are April to March), numbers from ORR data rounded to nearest 1000 (per year). Big thanks to Richard Lysons getting most of this data together.
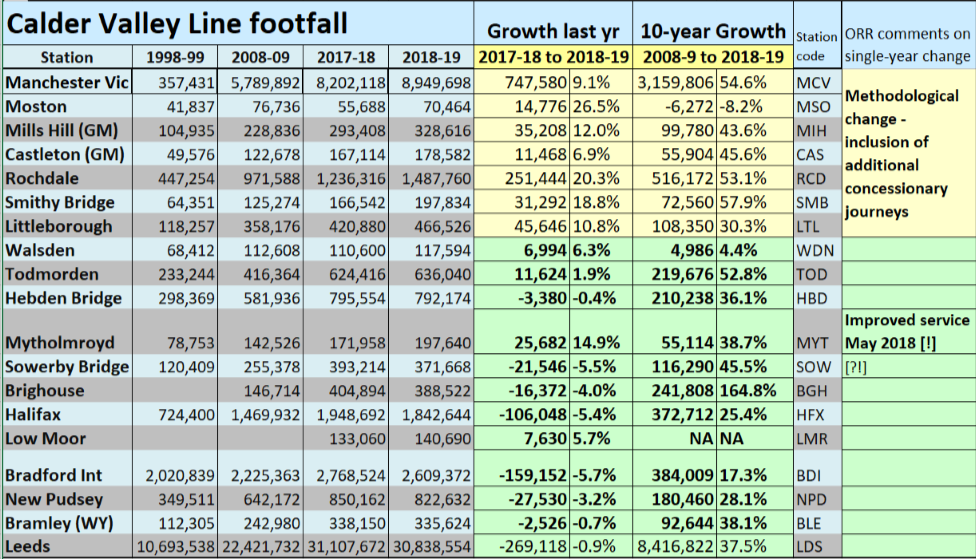
Rail can help revive our not so big towns too! Brighouse was fastest growing station on our line, percentage-wise, up to middle of last decade. Recently it has had more mixed results, due in part to services being diverted, or replaced by buses when TransPennine Express services are diverted. At present trains are replaced by buses Brighouse to Huddersfield, though that does not affect the above figures. On the other hand the station has benefited from extra trains to good places when TPEs call. So Brighouse needs a better service, as does Sowerby Bridge. Both stations serve as many potential passengers as Hebden Bridge but have about half the service level. Sowerby Bg needs all the trains that at present run through non-stop to call, and Brighouse – its line soon also to serve Elland – just needs more trains. Mytholmroyd is another matter, for another issue of this newsletter!
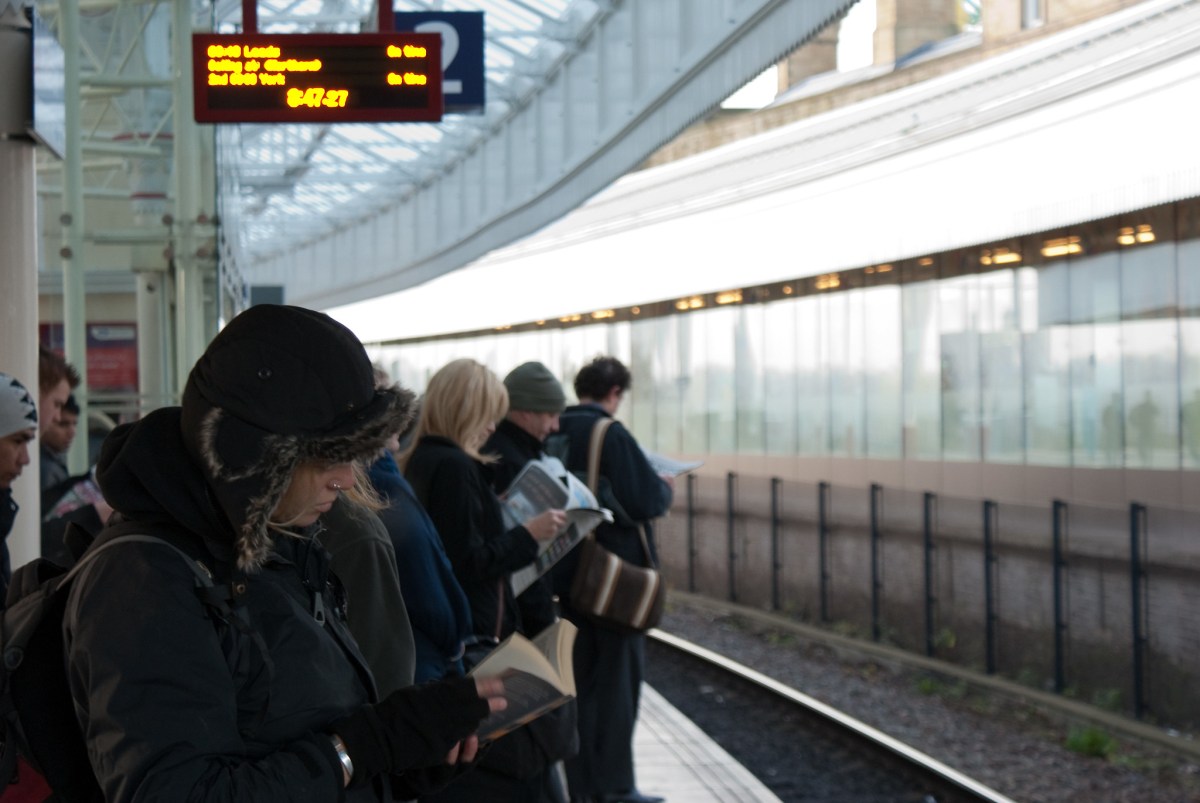
Header Image: “Halifax Station” by AdamKR is licensed under CC BY-SA 2.0.