
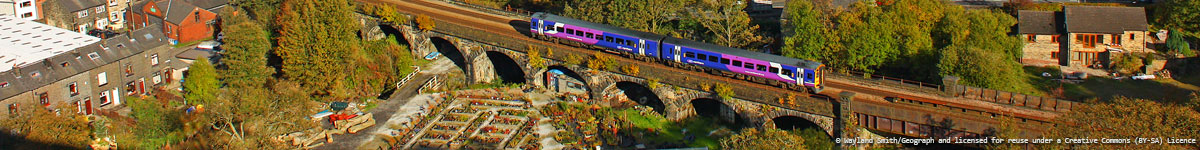

Network Rail say rail passenger numbers have doubled nationally over 20 years and will double again by 2041. But the top stations on our line can better that! Halifax station usage has doubled in just 10 years. Latest batch of station usage estimates from the Office of Rail and Road reinforce previous years’ results. ORR’s estimates are based on ticket sales. Refinements of methodology over the years mean caution is required when identifying trends. But some trends are clearly significant.
We have again done our homework on the ORR spreadsheet and calculated increases in estimated footfall over the last ten years (up to last spring), as well as the latest year-on-year figures. Our Calder Valley Line (CVL) table is ranked by 10-year growth, and once again Brighouse and Sowerby Bridge come out top. Brighouse has had another growth spurt (8.1% over last year), consolidating a spectacular 476% over ten years. Sowerby Bridge may have levelled off slightly this time — sign of demand starting to be suppressed by service limitations? — but 132% over ten years is still double the national average. These are of course our “Cinderella” stations; they serve medium-size towns comparable with Todmorden and Hebden Bridge but have significantly fewer trains. As we keep telling people, better services at Brighouse and Sowerby are surely overdue.
10-year growth exceeds the national average at all Calder Valley stations within West Yorkshire except Walsden and Mytholmroyd, the latter a significant village halt where untapped potential may emerge when the new car park opens. Overall, CVL stations are a little behind national growth figures, more significantly so on the latest year-on-year results. Again, is this the limitations of provided service suppressing demand?
Walsden is interesting with a sudden apparent spurt against declining trend. Look also at New Pudsey where morning peak trains regularly leave passengers behind. And Bramley, third from the top, last station before Leeds (but compare with Moston at the other end of the line). Any theories?
| CVL station usage statistics: entries and exits (extracted from Office of Road and Rail station usage estimates, December 2016 – growth calculations added for HADRAG by JSW) |
Year on year growth | Growth over 10 years | ||||||
| 2005-06 | 2013-14 | 2014-15 | 2015-16 | 13/14-14/15 | 14/15-15/16 | 05/06-15/16 | Mean/y | |
| Brighouse | 72,229 | 371,666 | 384,922 | 416,094 | 3.6% | 8.1% | 476.1% | 19.1% |
| Sowerby Bridge | 168,942 | 351,652 | 383,844 | 391,766 | 9.2% | 2.1% | 131.9% | 8.8% |
| Bramley | 154,249 | 317,132 | 305,580 | 315,342 | -3.6% | 3.2% | 104.4% | 7.4% |
| Halifax | 978,225 | 1,912,798 | 1,935,764 | 1,982,148 | 1.2% | 2.4% | 102.6% | 7.3% |
| Hebden Bridge | 385,768 | 739,112 | 764,354 | 756,508 | 3.4% | -1.0% | 96.1% | 7.0% |
| Todmorden | 311,986 | 548,152 | 563,920 | 585,310 | 2.9% | 3.8% | 87.6% | 6.5% |
| New Pudsey | 475,591 | 763,666 | 844,046 | 891,062 | 10.5% | 5.6% | 87.4% | 6.5% |
| Rochdale | 641,487 | 1,059,282 | 1,098,630 | 1,134,418 | 3.7% | 3.3% | 76.8% | 5.9% |
| Littleborough | 223,821 | 368,598 | 380,786 | 391,896 | 3.3% | 2.9% | 75.1% | 5.8% |
| Castleton | 85,695 | 143,506 | 148,596 | 148,262 | 3.5% | -0.2% | 73.0% | 5.6% |
| Mills Hill | 183,853 | 302,726 | 313,536 | 310,032 | 3.6% | -1.1% | 68.6% | 5.4% |
| Mytholmroyd | 107,107 | 156,704 | 171,704 | 164,742 | 9.6% | -4.1% | 53.8% | 4.4% |
| Smithy Bridge | 98,319 | 146,980 | 144,206 | 149,152 | -1.9% | 3.4% | 51.7% | 4.3% |
| Moston | 52,205 | 125,902 | 82,486 | 71,732 | -34.5% | -13.0% | 37.4% | 3.2% |
| Bradford Interchange | 2,482,799 | 2,990,294 | 2,922,956 | 2,993,340 | -2.3% | 2.4% | 20.6% | 1.9% |
| Walsden | 132,703 | 94,332 | 93,942 | 102,324 | -0.4% | 8.9% | -22.9% | -2.6% |
| CVL totals | 6,554,978 | 10,392,502 | 10,539,272 | 10,804,128 | 1.4% | 2.5% | 64.8% | 5.1% |
| National | 1,601,494,732 | 2,665,123,512 | 2,785,070,620 | 2,938,358,550 | 4.5% | 5.5% | 83.5% | 6.3% |
